

Features
Fresh data
Kappa scans the market every 5 minutes and recalculates stock fundamentals as prices change. Financial statements, balance sheets, and cash flow data are updated daily.
5000 stocks
Screen more than 5,000 US-listed stocks across NYSE and NASDAQ. Global market support is planned.
15 fundamentals
Kappa ranks stocks using 15 fundamental metrics across valuation, profitability, and financial strength. These include P/E, P/S, ROE, net margin, debt-to-equity, Piotroski F-score, and Altman Z-score.
Popular indexes
Filter stocks by major indexes, including the S&P 500, Dow Jones, Russell 1000, Russell 2000, and NASDAQ 100.
Built-in guide
Learn how Kappa’s factor-based ranking works and how to use it for long-term portfolio research.
Advanced filters
Refine your screen by market capitalization, industry, exchange, index, rating, and strategy.
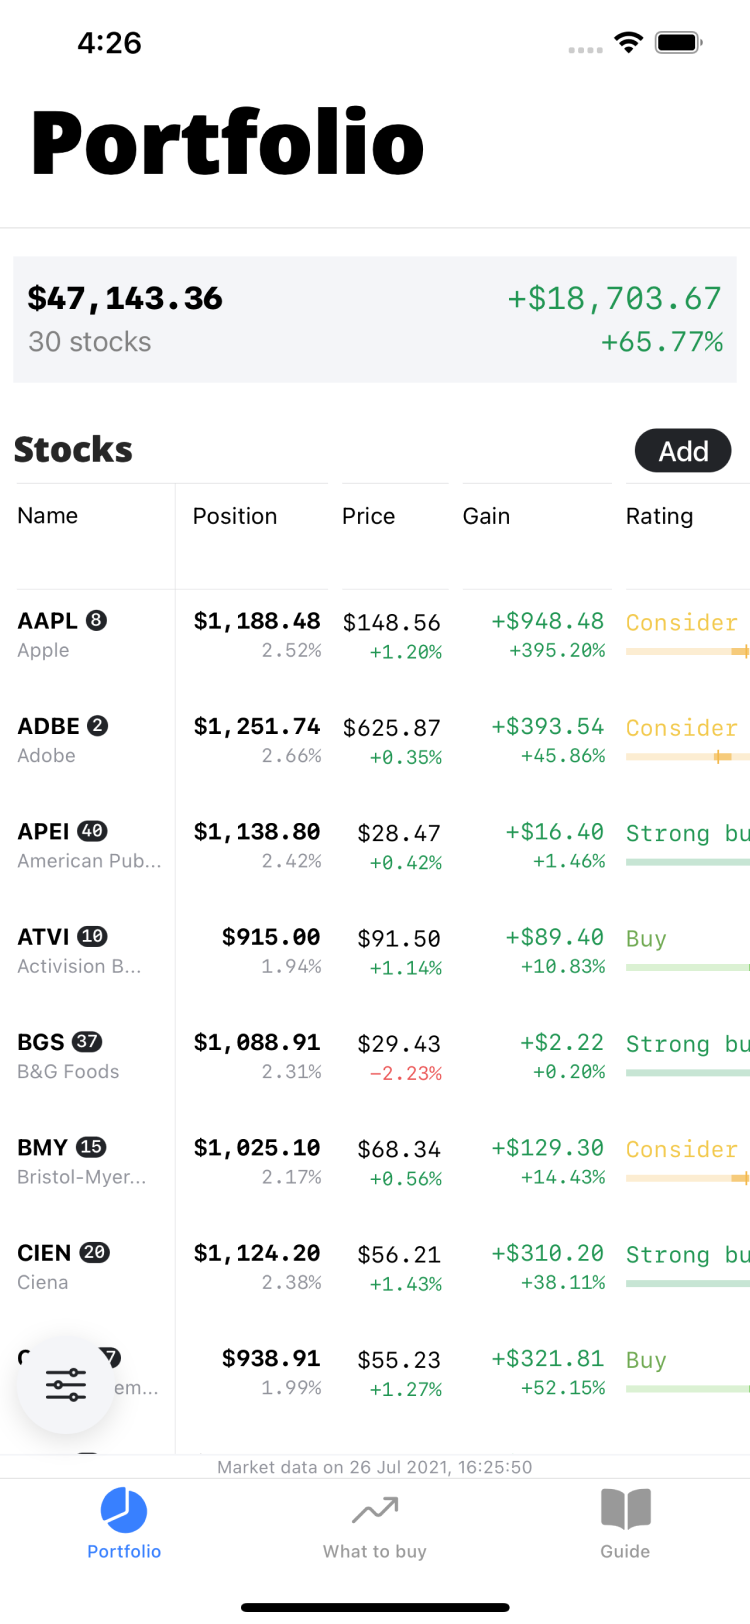
Portfolio tool
Track individual positions and portfolio performance. Review how your holdings rank by Kappa’s model over time.
Strategy ratings
Compare stocks across Kappa’s main strategies: Best Rating, Valuation, Profitability, and Financial Strength.
Value investing
Kappa helps long-term investors find companies that rank well by valuation, profitability, and financial strength.
Instead of chasing headlines, Kappa uses a factor-based model to compare stocks across 15 measurable fundamentals and highlight companies with strong overall ratings.
This is the idea behind factor investing: using persistent, measurable company characteristics to build a more disciplined investment process.
- Open the Best Rating strategy
- Build a diversified watchlist of high-rated stocks
- Review your portfolio once a year
Factor investing is widely used in quantitative and asset management strategies. Historical research has shown that valuation, profitability, and financial strength factors have been associated with long-term outperformance in certain periods.
Kappa brings this approach into a simple screener: rank stocks, compare fundamentals, build a diversified list, and review it periodically.
Discipline vs. Market
Factor investing is a systematic way to screen stocks by measurable company characteristics that have historically been associated with higher long-term returns.
Instead of trying to predict the next hot stock, factor investors compare companies by fundamentals such as valuation, profitability, and financial strength. Metrics like P/E, P/S, net margin, return on equity, quick ratio, debt-to-equity, Piotroski F-score, and Altman Z-score help evaluate how a company ranks relative to the rest of the market.
Kappa applies this idea through a multi-factor model based on 15 fundamentals. Each stock receives one of five Kappa ratings:
The goal is not to guess short-term price movements. Kappa is designed to help long-term investors build a more disciplined research process: find companies that rank well across multiple fundamentals, compare them with the market, and review the portfolio periodically.
Many investors use the S&P 500 as their default benchmark. But the S&P 500 is primarily a large-cap, market-cap-weighted index. Kappa helps investors look beyond index size and focus on fundamental quality: valuation, profitability, and financial strength.
Historical factor research suggests that systematically selecting companies with attractive fundamentals has outperformed broad market benchmarks in certain long-term periods. Kappa turns this research-driven approach into a simple stock screener and portfolio review tool.
Note: Historical performance and backtests do not guarantee future returns. Kappa is a research tool, not financial advice.
Strategies
Use Best Rating to find stocks that rank well across valuation, profitability, and financial strength. Or focus on one factor category: Valuation, Profitability, or Financial Strength.
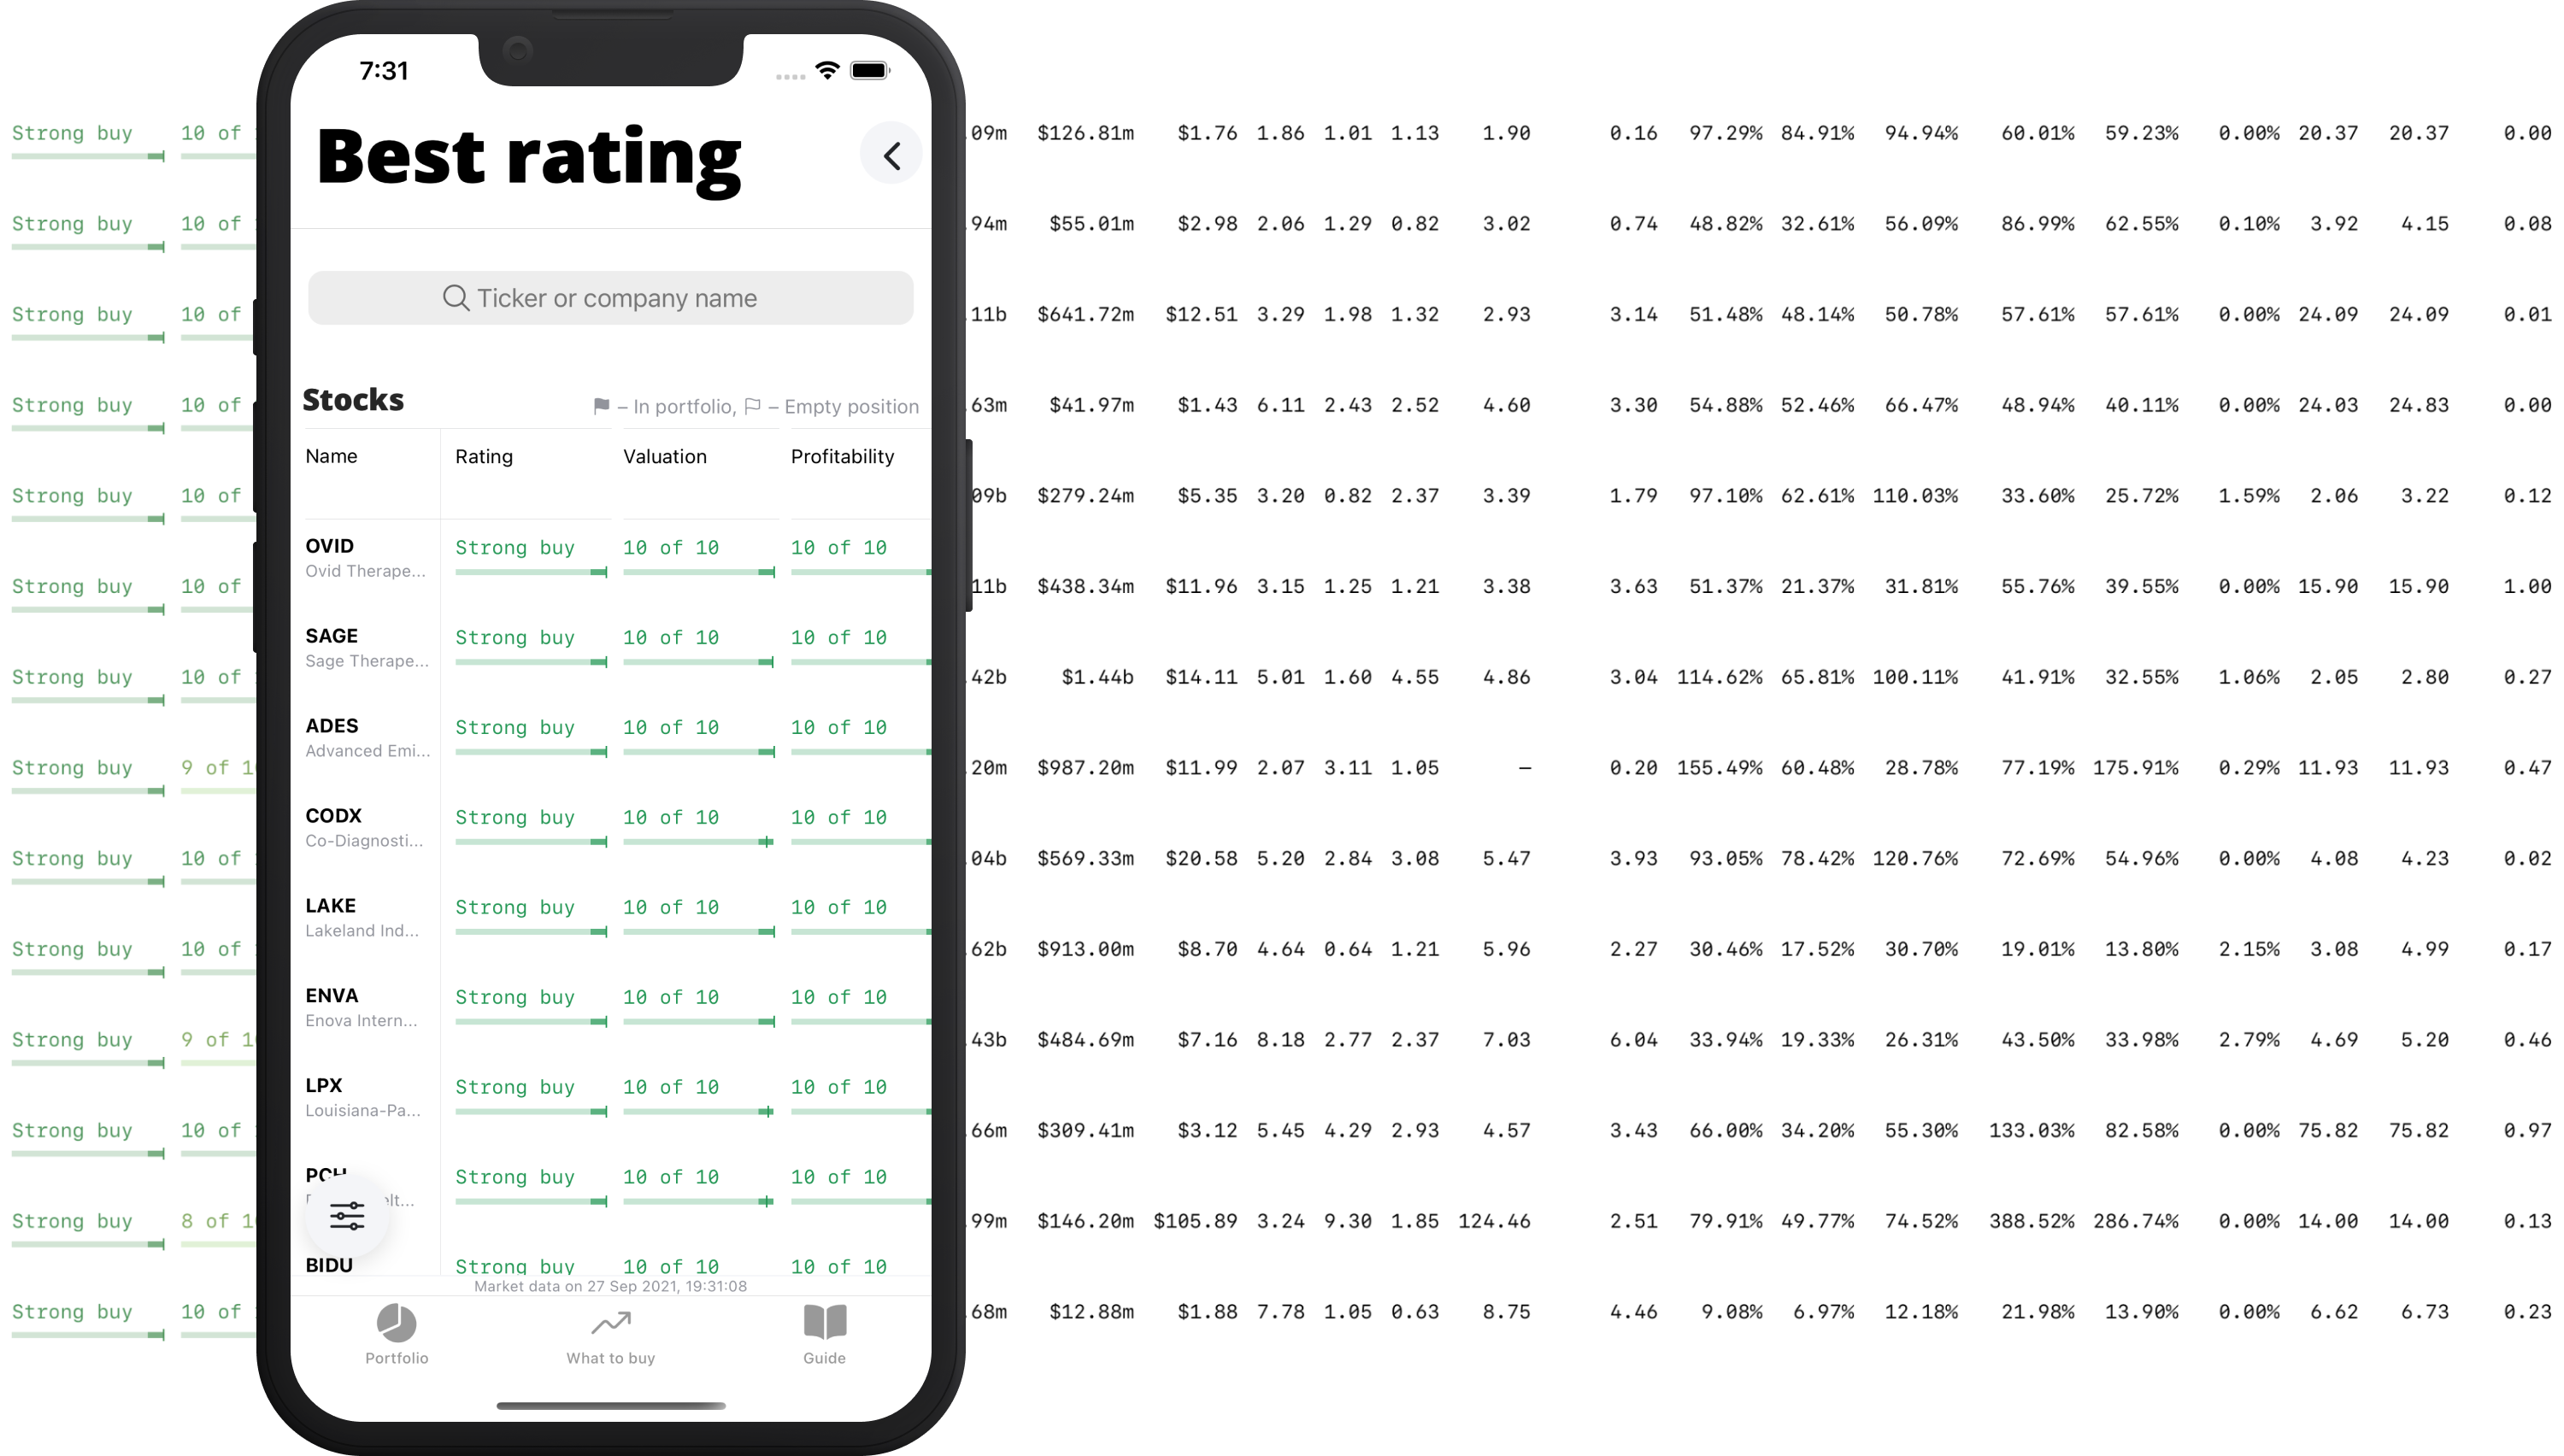
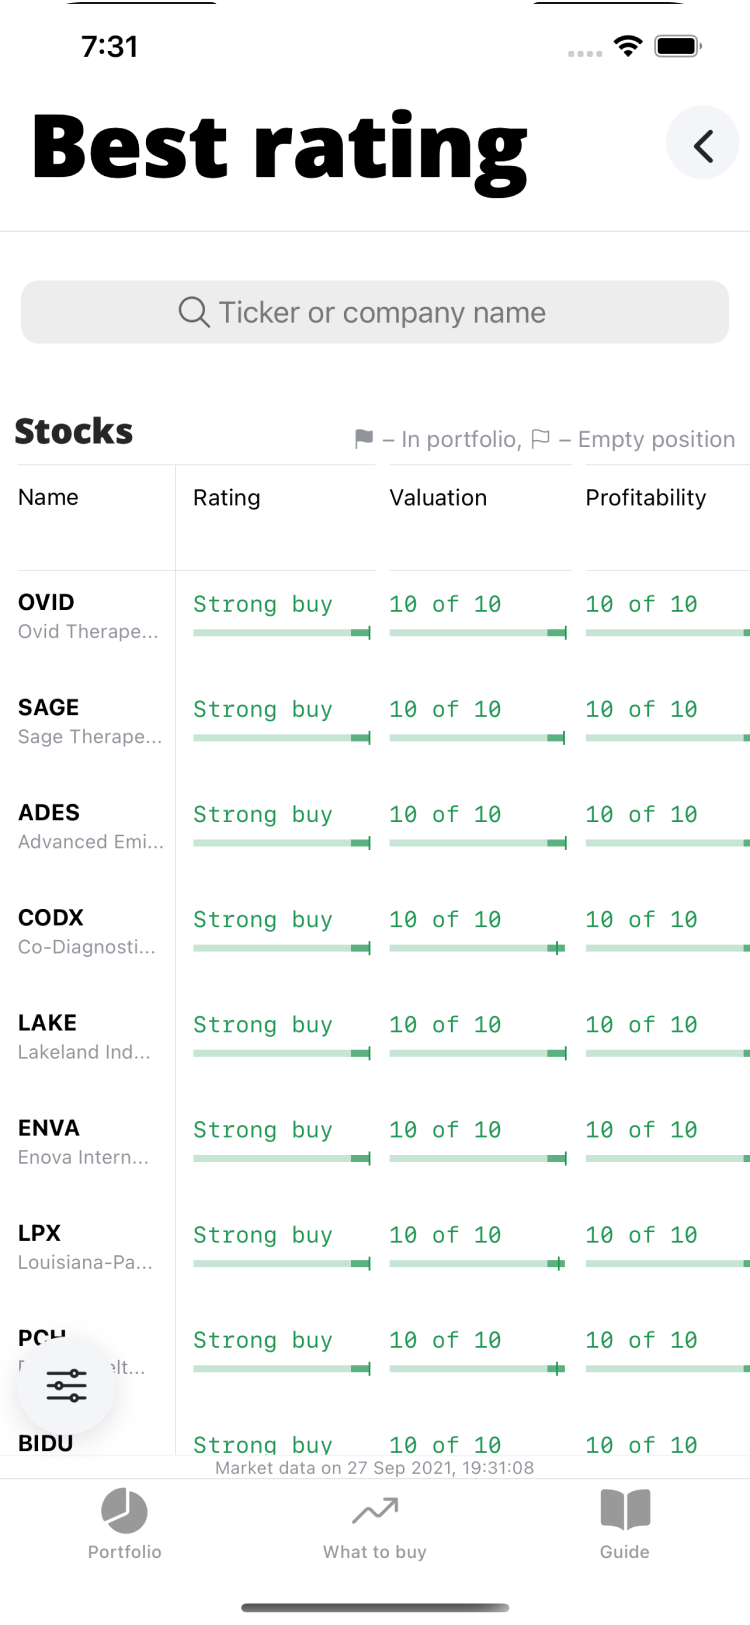
Best rating
Stocks with strong overall Kappa ratings across all three factor groups.
Valuation
Undervalued stocks
- P/E Price-to-Earnings
- P/S Price-to-Sales
- P/B Price-to-Balance
- P/FCF Price-to-Free cash flow
- EV/EBITDA Enterprise value to EBITDA
Profitability
Profitable companies
- ROE Return on Equity
- ROA Return on Assets
- ROI Return of Investments
- Operating margin
- Net margin
Financial strength
Financially resilient companies
- Quick ratio
- Current ratio
- Debt-to-equity
- Piotroski F-score
- Altman Z-score
How it works
Kappa ranks stocks by comparing each company with the rest of the market.
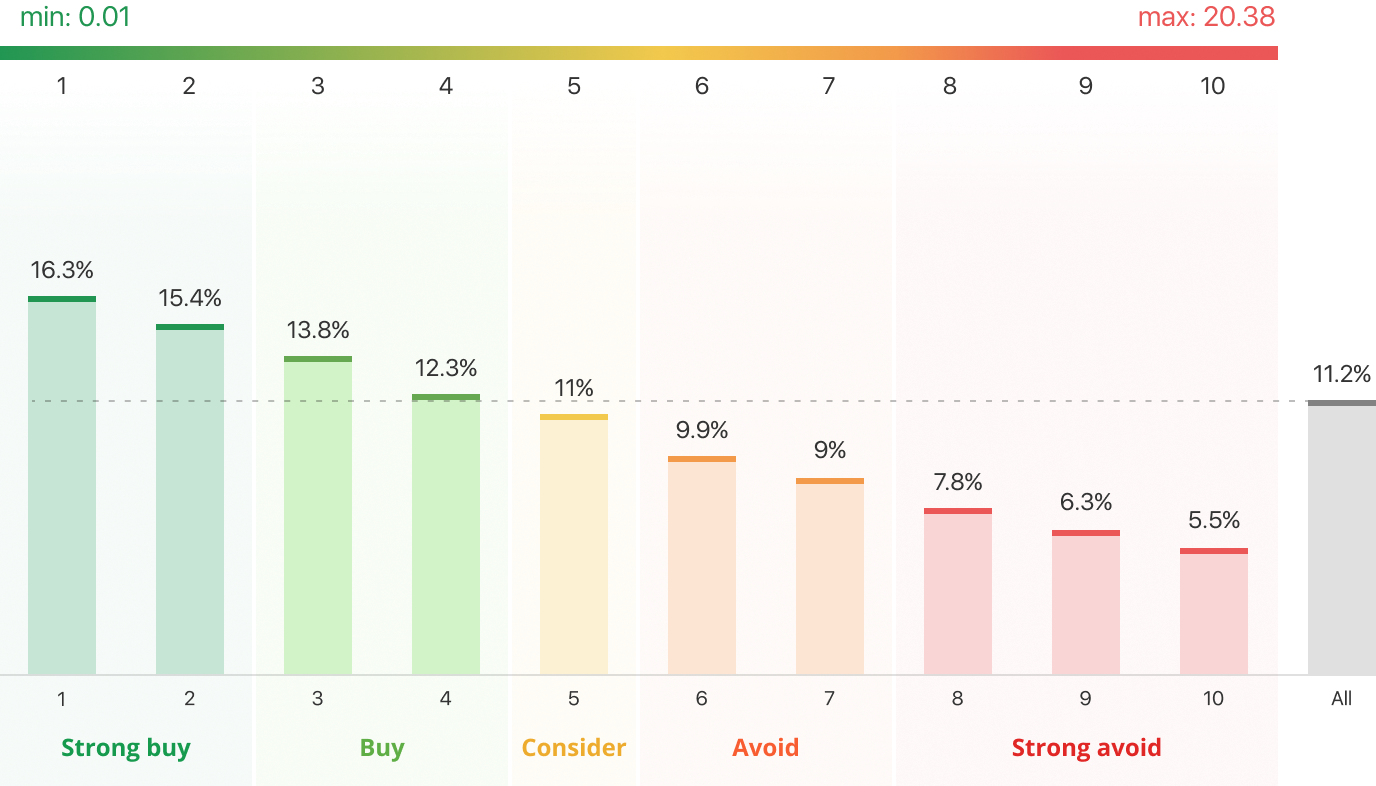
For example, take the Price-to-Sales ratio. Kappa sorts all available stocks by P/S and splits them into 10 equal groups called deciles. The 1st decile contains stocks with the lowest P/S values, while the 10th decile contains stocks with the highest P/S values.
This method is inspired by historical factor research popularized in James O’Shaughnessy’s What Works on Wall Street. In the book’s P/S decile study, the lowest P/S decile produced a 16.3% average annual return, the second decile produced 15.4%, and the full stock universe produced 11.2% over the tested period. The highest P/S deciles performed significantly worse.
Kappa applies a similar ranking logic across 15 fundamentals. Each metric contributes to the stock’s overall rating across valuation, profitability, and financial strength.
A Strong Buy rating means that a stock currently ranks highly across Kappa’s factor model. It does not mean the stock is guaranteed to rise. It means the company scores well relative to the market based on the fundamentals Kappa tracks.